More enterprise value from the customers you already own.
Most distributors only call on a small share of their accounts. The rest buy when they feel like it. A proactive inside sales team changes that, and turns the long tail into gross profit you can see and underwrite.
Three inputs. No login. You see your number right away.The value is in the accounts nobody calls.
Our white paper calls it undercovered customer growth: active customers with real potential but no planned, proactive coverage. Field reps can't reach them all. Inside sales can, at a cost you can see.
Coverage you can afford
One inside rep can own hundreds of accounts by phone and email. That makes it practical to cover the long tail your field team skips.
Gross profit, not just activity
Planned calls lead to broader category buying and more frequent orders. We count gross profit after the full program cost, not calls made.
EBITDA the next owner will believe
Defined accounts, owners, plays and a finance agreed baseline. A repeatable system holds up in diligence. A one time push doesn't.
"The investment thesis creates direction. The operating system creates enterprise value."From The Commercial Value Creation Gap, Ali Hasham
What is proactive coverage worth at your company?
Change three numbers. Everything else uses fixed assumptions you can open and read.
Your Commercial Value Opportunity
A quick look at trapped gross profit, coverage economics and commercial productivity in your business.
Limitations
- This is a capacity based scenario, not observed results. Assigned accounts are not the same as accounts actively contacted.
- Contribution counts rep pay only. Benefits, management, technology, onboarding, training, working capital and leakage are left out, so this is not EBITDA.
- Enterprise value applies an illustrative multiple to that contribution. Real value needs a finance agreed EBITDA and a defensible multiple.
- No Revenue Optics fees are included. The decline curve is not added to gross profit, to avoid counting the same dollars twice.
Your commercial value summary
Illustration only, not a forecast or guarantee. Based on your inputs and fixed planning assumptions.
What we build with you on the call
The same math across every company in the fund.
Ramp by year and value at your exit date.
Who to hire, which accounts first, and the proof point.
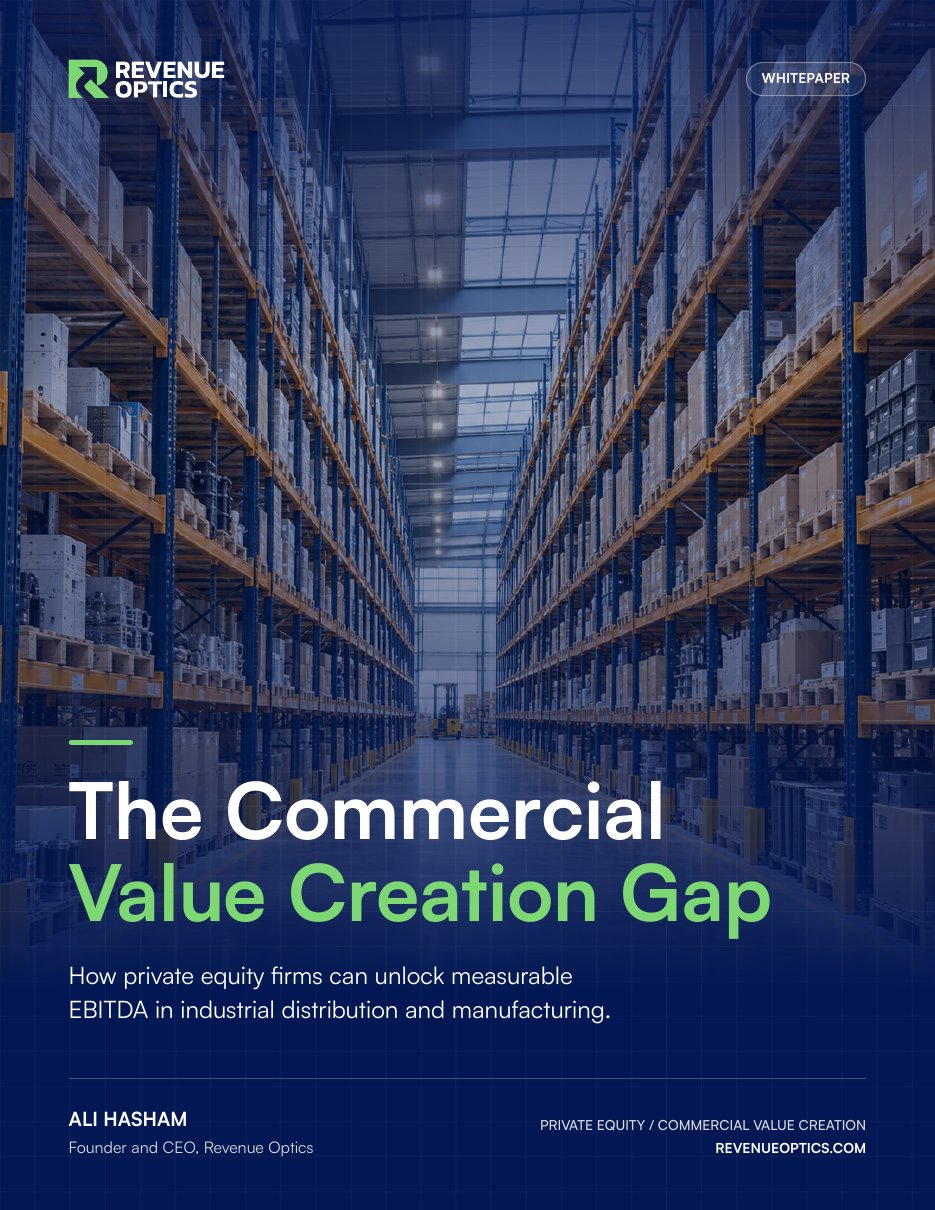
The Commercial Value Creation Gap
How private equity firms can unlock measurable EBITDA in industrial distribution and manufacturing. 13 pages, about 15 minutes.
- Where the deal thesis loses value after close
- Four value pools inside the business you already own
- How commercial value becomes recurring EBITDA
- A 180 day plan to prove the system, then scale the spend
Your numbers, checked by an operator.
Not a demo. You leave with something useful either way.
Pressure test the inputs
We check accounts, coverage and margin against how your company really sells.
See it across the hold
Ramp by year, value at exit, and how it rolls up across your portfolio.
Leave with a first 100 days
Which accounts first, who to hire, and the proof point finance will accept.
What if it doesn't work?
Start small
Begin with one company or one value pool. Spend is released in stages as evidence comes in.
Decide at day 180
Scale, adjust or stop based on customer outcomes, gross profit, full cost and payback.
Finance signs off first
We agree the baseline and attribution before launch, so nobody argues about the result later.
See your gap before your next board meeting.
20 minutes with our team, on your numbers. Bring one portfolio company. We'll bring the model.